
Productivity estimation for development teams based on Git metadata
Viktoria König
Introduction
Developer’s productivity is crucial to the success of getting one product to market on time and on budget. Many software companies tend to improve the productivity of their developers by using specific timeframes or metrics. They would set goals of what they would like to follow for a specific timeframe following specific standards within a company. However, until today, there is no known approaches to set the productivity standards across the industry.
To better understand productivity, we can use statistical evidence and probabilistic reasoning. They play an important and expanding role in software development, not least in relation to the processes and methodology for commercial software development. Executives, managers, team leads, and developers involved in managing large commercial teams of software developers must be able to comprehend and deal with probability and statistics appropriately. There is a long history and ample anecdotal evidence with misunderstandings relating to statistical information and probabilities which have led to fallacies, flawed deductive reasoning, and management misdirection that at least prove to be a nuisance to practicing commercial software developers and at worst sink promising software projects.
One approach to benchmarking developers’ productivity is through the Git metadata from software repositories. We classify commit-based metrics that are based on the developer’s commit activity. Based on the data analysis, we propose benchmark metrics that are usable across the software industry.
Problem statement
The definition of productivity is a relation between the input and the output, which can be the relation between time, money, and the produced result (Hernandez-Lopez et al., 2013). The concept is used in many industries, but in the current context of developer’s productivity, we tend to quantify the complexity or the size of the produced results.
Many software development companies tend to maximize the developer’s output with the input of money and time. Highly productive developers are always wanted when solving important development issues (Andreas Holzinger, 2005). Consequently, development productivity assessments are needed to specify where some developers could improve their working approach. However, the grades of the assessments are often the perceptions of the team leader (John McAvoy & Tom Butler, 2009). Therefore, their conclusions result in direct decisions among the developers and the management within a company (Trendowicz et al., 2009). These perceptions could be incorrect, when comparing a team to the industry. Potentially, a team could reach higher highs even though the team leader is over satisfied with the team’s work.
On the other side, individual productivity is difficult to be measured since every team member differently contributes to the team. One team member could be crucial to the other team members’ results (Nitin Agarwal and Urvashi Rathod, 2006). Therefore, developer productivity could be defined with multiple metrics that could show an overview of the team’s output, as a unit.
Metrics should be the goal of what developers should achieve. When bad metrics are chosen, that could lead the developers in the wrong direction. For example, if developers are rated on written lines of code (LOC), they tend to write more LOC to score better at the metric. That results in longer code, which will add additional complexity to the system. It is important to not let developers game the measurements by adding different metrics covering different aspects of the development process.
There have been multiple researches using questionnaires from software developers to specify their perceptions of whether they are productive or not (Meyer et al., 2014; see also Meyer et al., 2017; Storey et al., 2021). Apart from perceptions, there have been studies that specify different metrics based on data that could be found in the Git metadata (Mockus et al., 2002; see also Sheetz et al., 2009; Scholtes et al., 2015; Halstead, 1977; Lawrence, 1995; Petersen, 2010; Thongtanunam et al., 2016; Ahmed et al., 2017). However, there has not been a research that would be able to look past the perceptions of the developers, and benchmark metrics related to developer’s productivity which could be gathered from Git metadata.
Apart from the research, there are tools on the market that commercially analyze a project’s Git metadata. Currently, there are multiple analysis tools on the market. Some examples of them are GitClear, LinearB, Pluralsight Flow, Toucan Tuco, Waydev, and others. After testing the tools, we have concluded that none of these businesses contain benchmarks that compare productivity metrics with the industry.
Therefore, the goal of the thesis is to choose effective software productivity metrics based on gathered Git metadata from several industrial software repositories. Then, each individual’s software repository data can be compared to other repositories. Each project could be graded from 1 to 5, based on how good or bad they scored compared to other repositories of the same type, to categorize the effort into 5 categories (low to high). The same process could be applied to any new project, in order to assess the productivity at an early stage of the team and potentially improve future development.
Benchmark model
In order to create a benchmark, we need to collect data. The generated dataset contains 3.5M commits, 47’318 unique authors with 828’990 unique author-days, 9’609 development days among 5’751 repositories from 25 systems. The commits from the dataset begin from early 1990 until early 2022 and it includes 10 different programming languages.
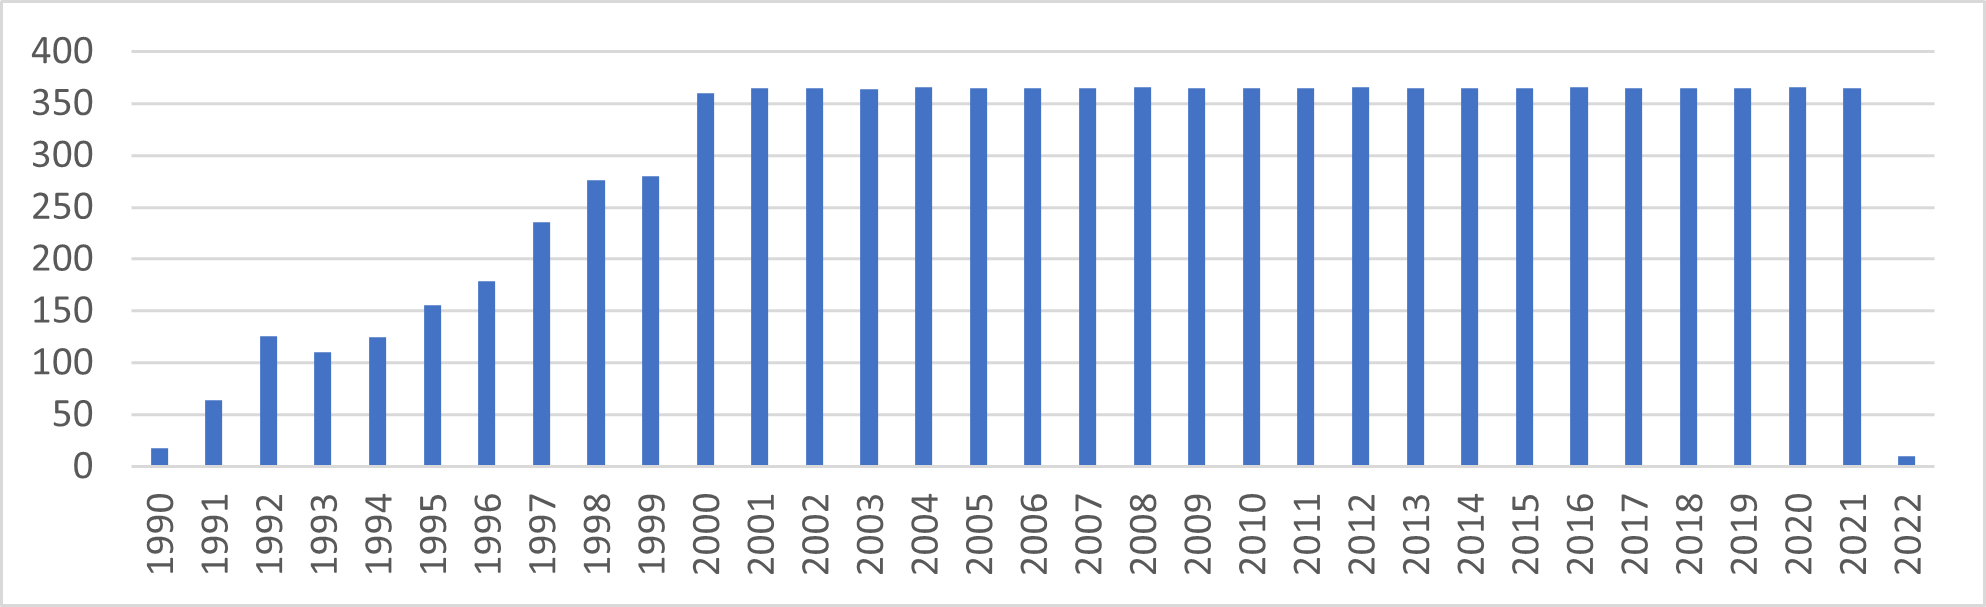
Figure 1: Active days in the dataset

Figure 2: Languages LOC diversification in the dataset
Metrics analysis
Since the Git metadata only contains the activity of the developer where they were interacting with Git, we could not show all the activities of a specific developer. Even though there are limitations, we propose a benchmark using commits, together with conflicts/merges ratio. The available commit metrics from the research are the following:
Commits over time (Mockus et al, 2002)
Committed lines of code over time (Steven at al., 2009)
Committed characters over time (Scholtes et al., 2015)
However, both commit metrics committed lines of code over time and committed characters over time proved to have a weak correlation to reality, we will discard them from the method (Oliveira et al., 2020).
Additionally, we propose a new metric to the analysis. Efficient code is code that has no-churn. Efficiency is the percentage of the code written by the team that is not churn. Churn is code that is removed and/or rewritten by the team. Therefore, the formula to calculate it is based on the following:
Efficiency % = Efficient LOC within a commit / (Efficient LOC within a commit + Churn LOC within a commit)
The goal of the metric is to analyze how efficient a team is when looking at the output of written code and to distinctify it between the unchanged and changed with removed code. Ideally, all of the code should be efficient code, with 100% efficiency. However, multiple factors could lower the efficiency ratio like customer or team lead changing requirements, or the developers performing code refactorings. Therefore, the metric could not be pointed to a single person, but the development process as a whole.
Another metric that could be analyzed is the active days of the developers, together with the number of commit days they have. With the following metrics, we want to understand the frequency of the committers (i.e., how often the total number of commits per day from an author falls into a specific range). Therefore, we could use the active days and commit days metrics to understand the types of authors and show if there is a difference among each author’s efficiency rate or conflicts/merges rate.
To conclude, we benchmark the following metrics:
Active days of developers
Commit days of developers
Efficiency rate of the team
Conflicts/merges rate of the team
Author segmentation
Using author segmentation, we want to understand whether there are different behaviors among authors. When exploring the metric Active days, we consider active days that an author committed a piece of code. Therefore, we are using only non-zero daily commit counts for authors. The purpose is to explore the days when authors commit their code. Furthermore, we want to understand how many commits on average an author commits on an active day. When processing the 3.5M commits dataset, we conclude that:
Median active days of authors are 2
Median commits per day of authors are 2
To understand the author-days frequency better, we split all of the committer’s commits per day to be grouped in a specific range. Using qcut as Python’s data frame quantile-based discretization function, we are able to distinctify three groups of authors and able to quantify the author behavioral pattern that is comparable across authors:
[1.0, 2.0] commits
[3.0, 5.0] commits
[6.0, 1208.0] commits
To understand the behavioral pattern better, we place each author’s commit day into one of the three groups and then we plot them to understand how much of the commits fall into each of the categories. Additionally, we separate the committers by three periods of active days of the year, based on many trials and errors with the data:
(0, 180]
(180, 250]
(250, 366]

Figure 3: Profile curve among authors that were active with a maximum of 180 days of the year
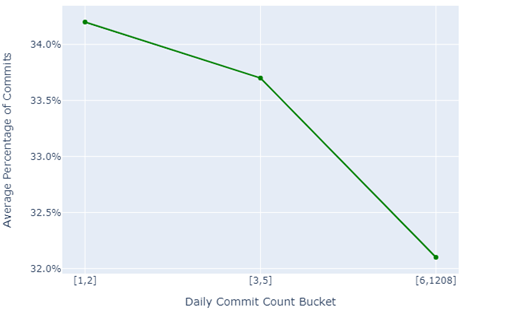
Figure 4: Profile curve among authors that were active with a minimum of 181 days and a maximum of 250 days of the year

Figure 5: Profile curve among authors that were active with a minimum of 251 days and a maximum of 366 days of the year

Figure 6: Profile curves among different author types
Using Figures 3 to 6, we can see that there is a behavioral difference between the three groups. Therefore, we give each of the groups a distinctive name according to their behavior.
Occasional contributors
Primary contributors
Leading contributors
Occasional contributors have the lowest contribution level (number of commits per day), Primary contributors show the mid-range contribution level, and the Leading contributors show the highest contribution level.
Finally, we analyze each author's behavioral pattern and assign a nearness score to one of the three author segmentation groups. Initially, we analyze how often an author commits to one of the three commit count buckets, based on the percentage of time that an author spends in each bucket ([1,2], [3,5], [6,1208]). Then, we compare each author’s behavioral pattern and produce a similarity score to a typical author segmentation group (see Figure 6). In the last step, we add the name of the group they have the most similarity with. The results can be seen in Table 1.
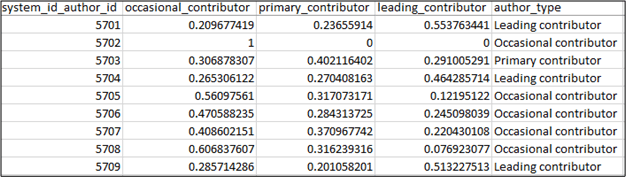
Table 1: Authors' behavior mapped to type of an author
Commit days metric
The median commits for all authors as a group per day is between [1,2]. However, after analyzing author commit behavior, we should get notably different results for each group in our metrics (see Figures 7-9).
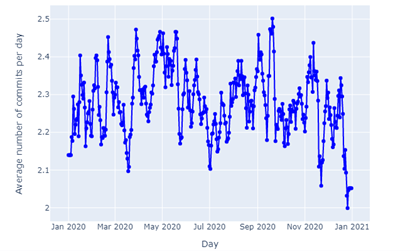
Figure 7: Average commits per day for Occasional contributors
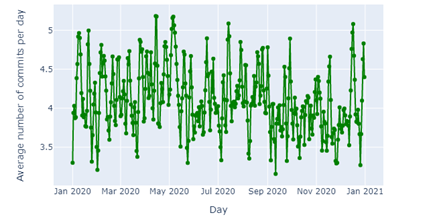
Figure 8: Average commits per day for Primary contributors

Figure 9: Average commits per day for Leading contributors
By looking at the three author types, we can conclude that Occasional contributors commit around 2 commits per day, Primary contributors commit between 3.5 and 5 commits, and Leading contributors commit between 6 and 14 commits per day.
Repeating the same analysis on a weekly basis (see Figures 10-12), we can conclude that Occasional contributors commit around 5 commits per week, Primary contributors commit around 14 commits per week, and Leading contributors commit around 36 commits per week.
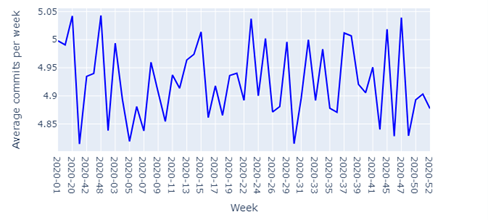
Figure 10: Average commits per week for Occasional contributors
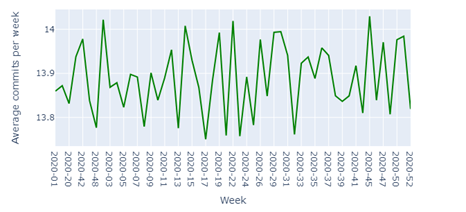
Figure 11: Average commits per week for Primary contributors
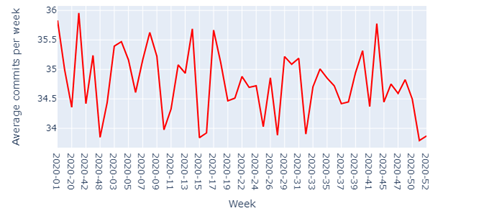
Figure 12 : Average commits per week for Leading contributors
Active days per week metric
We want now to understand how many days of the week each author type is active. When looking at Figure 13-15, we can see a noticeable difference between the three author types. Occasional contributors are active around 2 days per week, Primary contributors are active around 3 days per week, and Leading contributors are active 4 days per week.

Figure 13: Active days per week for Occasional contributors

Figure 14: Active days per week for Primary contributors

Figure 15: Active days per week for Leading contributors
Efficiency metric for author types
We wanted to understand if the presented different types of authors have different efficiency scores. The answer is that there is a notable difference among authors types. Occasional contributors score between 88% and 93% efficiency, Primary contributors score between 80% and 82%, and Leading contributors score between 78% and 80%. This metric concludes that the more active days the author type has, the more likely it is that some refactoring occurs in their work. Therefore, we see a worse efficiency rate for Leading contributors and a better efficiency rate for Occasional contributors.

Figure 16: Active days per week for Occasional contributors

Figure 17: Active days per week for Primary contributors

Figure 18: Active days per week for Leading contributors
Efficiency metric across systems
Efficiency can be measured on the whole system, combining all of the three types of developers. The system’s efficiency mean is 71%, and the median is 74%. Using qcut, we are able to divide the system’s efficiency into three buckets. Therefore, the following efficiency brackets are seen:
[0% – 70%] – Low Efficiency
(70% - 87%] – Average Efficiency
(87% - 100%] – High Efficiency
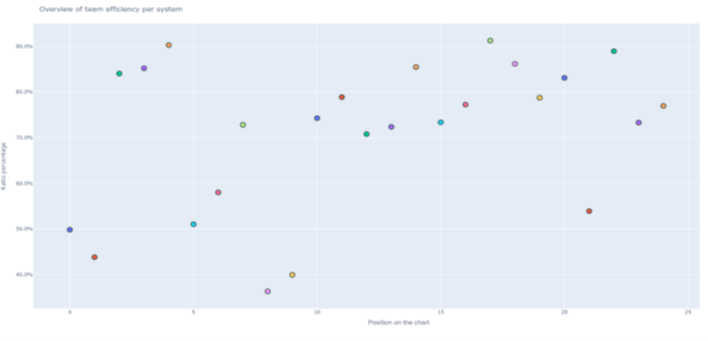
Figure 19: Efficiency of the development teams per system in our database
Conflicts/merges ratio metric for author types
We wanted to understand what the status of conflicts in merging code among different author types is. For the specific metric, we concluded that there are visual differences between Occasional, Primary, and Leading contributors (see Figure 21-23). When having a visual observation, Occasional contributors tend to create more conflicts within code merges than the other two groups. Since the sample size among author types is not equal to 6’872 Occasional contributors, 247 Primary contributors, and 121 Leading contributors, we performed a t-test between the samples to understand if they are different. The t-test’s null hypothesis was that the author types are equal. When comparing Occasional and Primary contributors, the p-value resulted with 0.22. When comparing Primary and Leading contributors, the p-value resulted in 0.33. Finally, when comparing Occasional and Leading contributors, the p-value resulted with 0.77.
Since the p-value for all cases was larger than 0.05, we show that the null hypothesis is true and there are insignificant differences among the author types when looking at conflicts/merges ratios. Even though we could not prove statistically that the samples are different, visually we could see that Occasional contributors tend to have a higher conflicts/merges ratio than the other two author types. Also, we wanted to understand what the mean among the samples is. The mean of the conflicts/merges ratio among Occasional contributors is 2%, among Primary contributors is 4.3%, and among Leading contributors is 2.3%.

Figure 20: Conflicts/merges ratio for Occasional contributors

Figure 21: Conflicts/merges ratio for Primary contributors

Figure 22: Conflicts/merges ratio for Leading contributors
Conflicts/merges ratio metric across systems
We wanted to know what the industry standard for conflict/merges ratio is and therefore we plotted all the systems we have in the database. The mean conflicts/merges ratio is 4%. Using qcut, three data brackets emerge for system conflict/merges ratio:
[0% - 1%] – Low conflict/merges ratio
(1% - 4%] – Average conflict/merges ratio
(4% - 100%] – High conflict/merges ratio
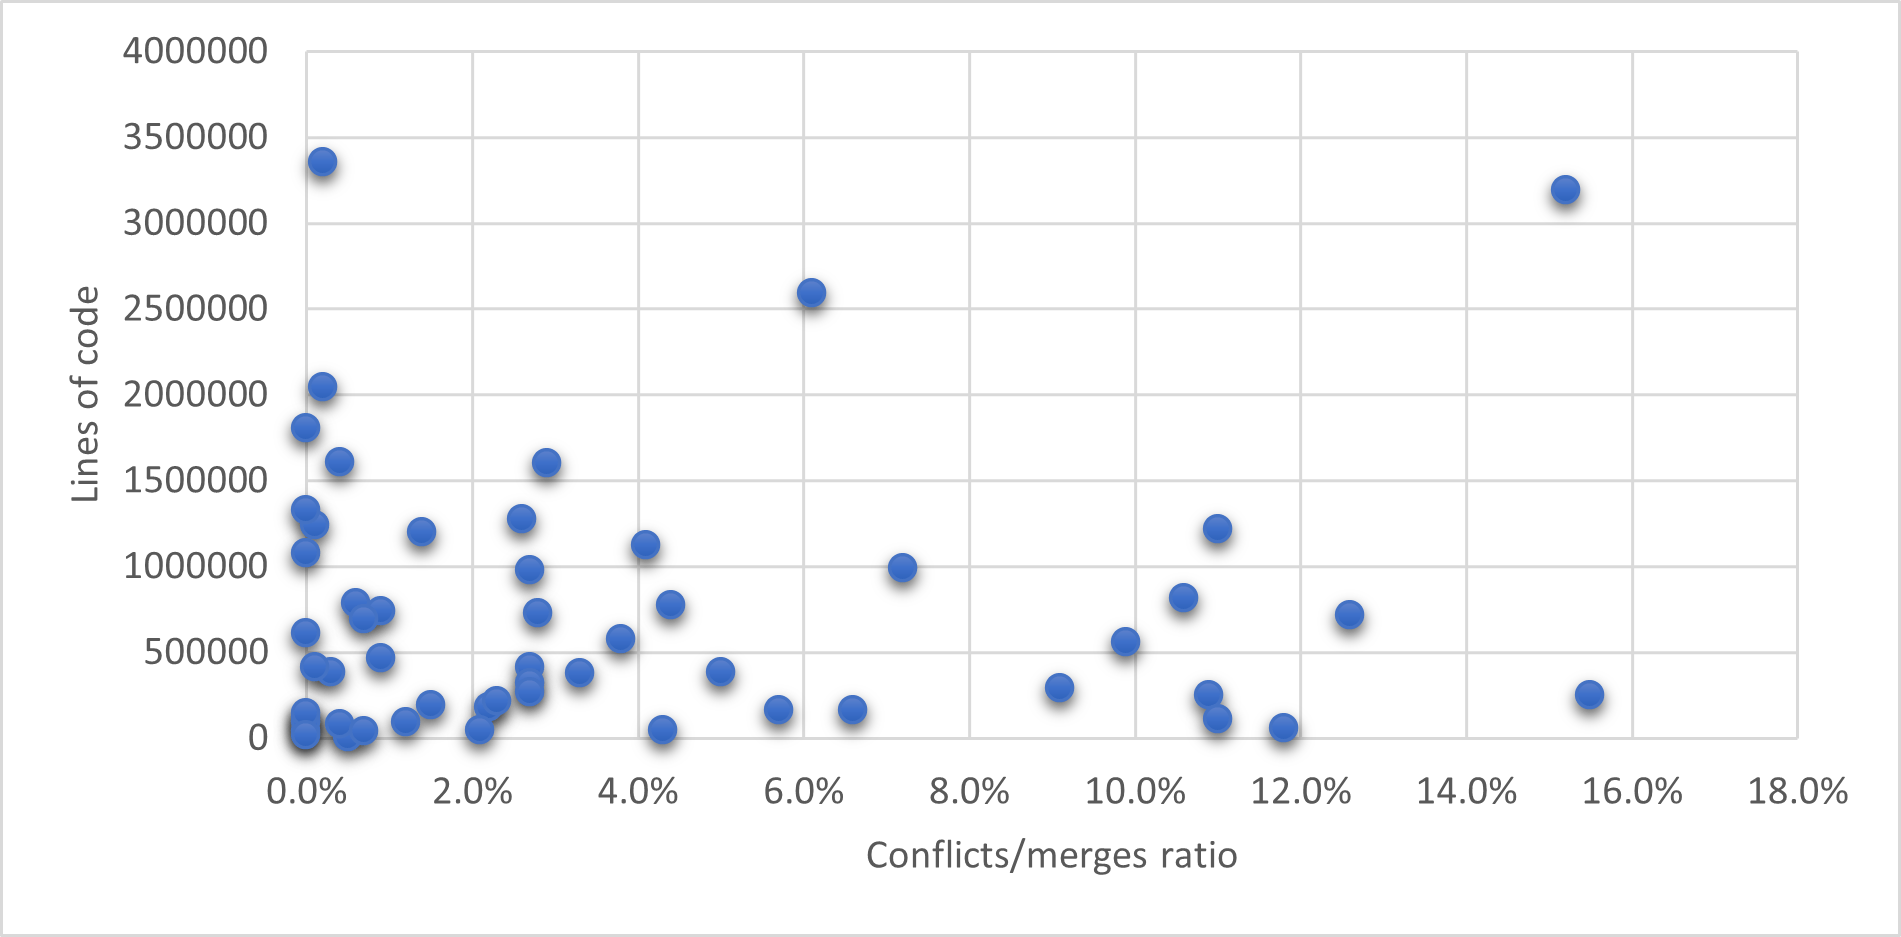
Figure 23: Conflicts/merges ratio across systems in our database
Overview of the system - GitSource
The system, named GitSource, shall be able to successfully be run on the terminal. While running, all of the commits shall be parsed, and the data stored in a database. Then, all the mentioned metrics like commits per day, commits per week, active days, efficiency, and conflicts merge ratio shall be analyzed and its data should be stored in the database. The data should be read by an API and shown on a front-end application. The visualizations shall be created with Plotly, a library based on D3.js.
Software architecture design
The architecture consists of three parts: a command-line application coded in Python that is able to analyze a system code fundamentals over time and store the data into a MongoDB database. Then a backend REST API written in Python Flask is provided to read data from the database, and a front-end application written in React is able to show the data retrieved from the database.
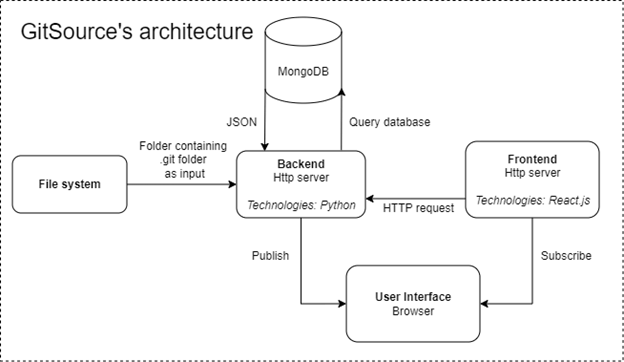
Figure 24: Overview of GitSource’s architecture
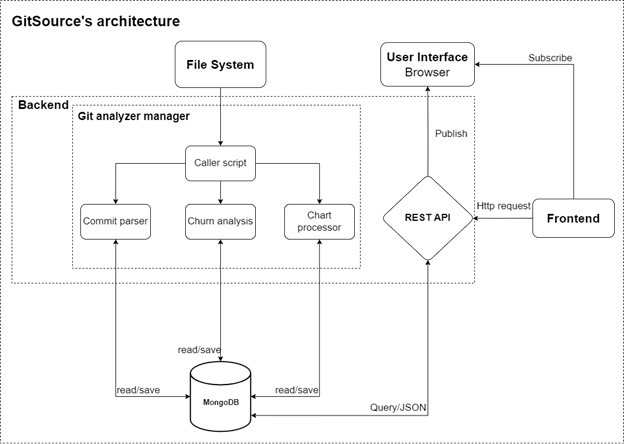
Figure 25: Detailed view of GitSource’s architecture
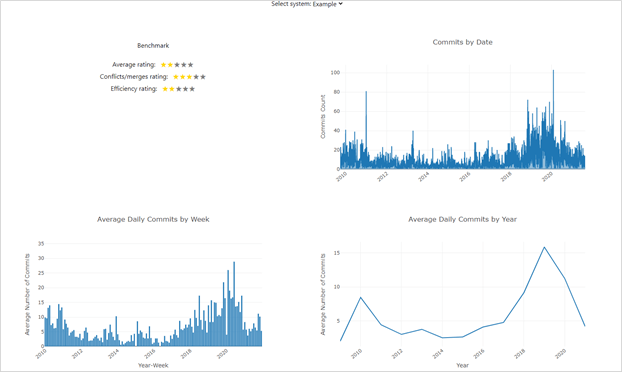
Figure 28: GitSource frontend view
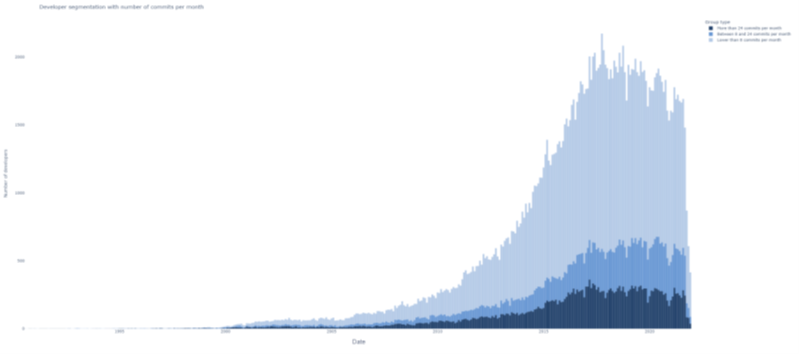
Figure 29: Authors type segmentation chart, where the lightest blue shows the Occasional contributors, the middle blue color shows the Primary contributors, and the dark blue shows the Leading contributors in the whole database over time

Figure 30: Authors heatmap with different colors, where every line is a unique developer that shows the developer’s commit activity over time
Evaluation
The goal of the evaluation is to show how useful, easy to navigate and correct GitSource is. To execute an evaluation of the usability, utility, and perceived correctness of the system, we had individual structured 45-minute interviews with three participants. The participants were the software architects of three of the systems that we analyzed in the database. The interviewed architects were working closely with the teams to build up the software and they knew the potential of the team and their weak sides. In addition, the architects were leading the following systems:
Java and React system, 158 contributors, 700’000 LOC
Java and Angular system, 202 contributors, 2’500’000 LOC
Python system, 1201 contributors, 3’200’000 LOC
The interview with the architects was planned to contain a survey when starting the interview for 10 minutes, a workshop for 25 minutes, and a second survey at the end of the interview for 10 minutes. The first questionnaire was about rating the productivity within their teams. In the questionnaire, we were interested to find out their perceptions of the teams they were working with. The workshop contained two parts – to present the tool and its capabilities, and to let the participants use the tool. The last questionnaire contained open-ended questions to understand how useful the tool was to them.
The initial questionnaire was separated into three groups of questions – “Productivity perception”, “Interviewee experience within the team”, and “Benchmark questions”. A group of the questions was “What do you think about the productivity of your team?”, “How would you rate the productivity of your team from 1 to 5?” and “Where do you think your team could improve their productivity?”, which gave us an understanding of their perception about the team they were working with. To validate their answers, we wanted to understand how long they were working with the team, whether it was from the very beginning, or they recently joined the team as software architects. Another group of questions was related to our benchmark – “What is your perception regarding the percentage of deleted or modified code within the team?”, “Do you think that rewriting code, impacts the productivity of the team?”, “What is your perception regarding the number of conflicts when merging code within the team?”, and “Do you think that conflicts impact the productivity of the developers?”.
Then, we explained the visualizations of our tool and how it is used. The participants were given the following tasks to be executed while using the tool for some time to better understand the results of their teams:
Task 1: Find where your system is located compared to other systems in Efficiency
Task 2: Find the most efficient author
Task 3: Count how many authors have no conflicts while merging their code
In the end, the participants were asked for qualitative feedback on the tool. It contained the following open-ended questions – “How hard or easy was the navigation and understanding of the tool?”, “Did your perception for productivity change after the workshop?”, “How accurate were the shown results?”, “How complete was the analysis for your team?”, “Where do you see your team improve for the future?”, “What would you add to the tool as a feature?” and “Would you consider getting a license and using the tool regularly during their development?”.
Results and dicussions
In the following part of the evaluation, when enumerating or mentioning the results, they are mentioned in the following order: Java and React system, Java and Angular system, Python system. These were the results from the systems in our benchmark metrics:
Efficiency: 3 stars, Conflicts/merges ratio: 1-star, Average stars: 2
Efficiency: 5 stars, Conflicts/merges ratio: 3 stars, Average stars: 4
Efficiency: 4 stars, Conflicts/merges ratio: 4 stars, Average stars: 4
In the first questionnaire, all the participants’ perceptions were that their teams could be more productive and rated their teams with 3, 4, and 4 points. Regarding the architects’ experience within the teams, all of them were part of their team since the beginning of the creation of each software. That showed us that all their answers are very credible since they have a long experience working with the teams. Furthermore, they mentioned that they have issues with communication within the team and not following deadlines, coordination issues among teams, and lack of alignment between the customer and the developers. Regarding our benchmark questions, all of them did not have a clear perception regarding how efficient their teams are when rewriting and deleting code, except for the sprints where that were purposefully aimed at rewriting code. All of them were not aware of the number of conflicts introduced into the team when merging code. They all agreed that rewriting and deleting code and having conflicts could affect the productivity of the team.
In regard to the given tasks, the answers were correct between all of the three participants. They were able to understand GitSource’s purpose and quickly navigate through the tool. Furthermore, the qualitative questionnaire proved exactly the impressions from the workshop, since they all answered that the tool was easy to understand and navigate. Regarding the results about the metrics from the tool and the participants’ perceptions, the first participant mentioned that they had meetings where the topic was about conflicts when merging the code into the codebase, and the amount of time that developers had to merge the code. That was because developers were working on the same parts of the code. Additionally, he mentioned that they had parts of the code that were completely rewritten, and therefore the results proved to be correct. The second participant answered that he as an architect, and a team leader carefully plans the features to be built, and therefore he was satisfied that his team was able to be at the top of the industry regarding efficiency. Regarding the conflicts/merges ratio, he was surprised that his team scored only 3 stars, and wanted to confirm that with other team leaders where there could be potential issues. The third participant stated shortly that the results proved to be according to his views. All the participants stated that the tool does not show the full productivity of the developers, since there are multiple factors when looking at productivity. Only the third participant added that it would be interesting to look at the relation of Jira tickets vs. Efficiency. Regarding the last question about using the tool during regular development, the first and the third participant answered that they would be happy to get a license and use the tool regularly.
We see that the main threat to the validity of the results is the consistency among the participants, even though separate meetings were held. However, we were able to almost match the perceptions of the participants’ team productivity ratings with the tool ratings. Overall, the tool was able to tackle the ongoing issues the teams had, however, we were not able to show the full picture of the issues that the architects mentioned in the first questionnaire. That is because the tool itself has its limits to only viewing Git data. On the other side, we find the remark valuable to incorporate the number of Jira tickets or stories completed, together with the Efficiency of the team.
Conclusion
We developed a tool that is able to analyze Git metadata, show multiple visualizations about the system and its developers. The tool makes it easier to understand specific aspects of the developer’s productivity and it is able to benchmark the efficiency of the team and the number of conflicts when merging code within the team. We were able to rely on concurrency to increase the speed of data parsing and chart processing. We followed different researches regarding metrics and had multiple interviews with representatives from on-the-market tools that show the development activity. We concluded that none of the researches or the on-the-market tools contain benchmarking features regarding their data, and therefore that was the goal of our thesis. Additionally, the developer’s segmentation with three types – Occasional, Primary, and Leading developers helped to show the different behaviors among different developer types. During our evaluation interviews, the participants showed interest in the tool and they were able to easily navigate it. We were able to almost match their expectations, and out of three participants, two were interested to use the tool regularly during their development. They mentioned that the current approach has its limitations regarding the data it can take to analyze the developer’s productivity.
Parts that could be improved for future iterations is front-end visualization of the data. We believe that it could be made even simpler to use. Also, the front end needs to load the data faster from the database from the Rest API. Currently, we pull all of the data at once, and instead, we could lazy-load the browser, in terms of, some charts will load first, and the others will be loaded later. Additionally, when benchmarking the data, we could rely on fuzzy methods to improve the categorization and overall analysis.
Do you want to test GitSource? Please contact us
References
Agarwal N., Rathod U. (2006) Defining ‘success’ for software projects: An exploratory revelation, International Journal of Project Management, Pages 358-370, DOI: https://doi.org/10.1016/j.ijproman.2005.11.009.
Ahmed I., Brindescu C., Mannan A. U., Jensen C., Sarma A. (2017) An Empirical Examination of the Relationship Between Code Smells and Merge Conflicts, 2017 ACM/IEEE International Symposium on Empirical Software Engineering and Measurement (ESEM), pp. 58-67, DOI: 10.1109/ESEM.2017.12.
Baltes S., Knack J., Anastasiou D., Tymann R., Diehl S. (2018) (No) Influence of Continuous Integration on the Commit Activity in GitHub Projects 10.1145/3278142.3278143
Beller M., Orgovan V., Zimmermann T. (2020) Mind the Gap: On the Relationship Between Automatically Measured and Self-Reported Productivity https://arxiv.org/pdf/2012.07428.pdf
Boehm B., Clark B., Horowitz E. et al. (1995) Cost models for future software life cycle processes: COCOMO 2.0. Ann Software Eng 1, 57–94 https://doi.org/10.1007/BF02249046
Brindescu C., Ahmed I., Jensen C., Sarma A. (2019) An empirical investigation into merge conflicts and their effect on software quality https://www.ics.uci.edu/~iftekha/pdf/J4.pdf
Christian A., Daneva M., Damian D. (2014) Human factors in software development: On its underlying theories and the value of learning from related disciplines. https://doi.org/10.1016/j.infsof.2014.07.006
de Aquino Junior G., Meira S. (2009) Towards effective productivity measurement in software projects. In: Proceedings of the 4th International Conference on Software Engineering Advances (ICSEA), pp 241– 249
Forsgren N., Storey M., Maddila C., Zimmermann T., Houck B., and Butler J. (2021) The SPACE of Developer Productivity: There's more to it than you think. Queue 19, 1, Pages 10 (January-February 2021), 29 pages. DOI: https://doi.org/10.1145/3454122.3454124
Gousios G., Kalliamvakou E., and Spinellis D. (2008) Measuring developer contribution from software repository data. In Proceedings of the 2008 international working conference on mining software repositories (MSR '08). Association for Computing Machinery, New York, NY, USA, 129–132. DOI: https://doi.org/10.1145/1370750.1370781
Halstead M. (1977) Elements of software science https://dl.acm.org/doi/10.5555/540137
Harding B. (2021) Measuring developer productivity in 2022 for data-driven decision makers https://www.gitclear.com/measuring_developer_productivity_a_comprehensive_guide_for_the_data_driven
Harding W. B., (2021) Software effort estimates vs popular developer productivity metrics: a case study of empirical correlation https://api.amplenote.com/v2/view/aMM59VVrwALefeHoPbJE2otR/attachments/3ff02c17-aebe-47e6-a1a1-7195d42a0653
Hernandez-Lopez A., Colomo-Palacios R., Garcia-Crespo A. (2013) Software engineering job productivity – a systematic review. Int J Softw Eng Knowl Eng 23(03):387–406. https://doi.org/10.1142/S02181940 13500125
Holzinger A. (2005) Usability engineering methods for software developers. Commun. ACM 48, 1. DOI: https://doi.org/10.1145/1039539.1039541
Ji T., Chen L., Yi X. and Mao X. (2020) "Understanding Merge Conflicts and Resolutions in Git Rebases," 2020 IEEE 31st International Symposium on Software Reliability Engineering (ISSRE), pp. 70-80, DOI: 10.1109/ISSRE5003.2020.00016.
Lawrence. M. J. (1981) Programming methodology, organizational environment, and programming productivity. J. Syst. Softw. 2, 3 (September 1981), 257–269. DOI: https://doi.org/10.1016/0164-1212(81)90023-6
Lorenz M, Kidd J. (1995) Object-oriented software metrics: A practical guide, Prentice-Hall, Englewood Cliffs https://www.worldcat.org/title/object-oriented-software-metrics-a-practical-guide/oclc/30026558
Macak, M., Kruzelova, D., Chren, S. et al. (2021) Using process mining for Git log analysis of projects in a software development course. Educ Inf Technol 26, 5939–5969 https://doi.org/10.1007/s10639-021-10564-6
McAvoy J., Butler T. (2009) The role of project management in ineffective decision making within Agile software development projects, European Journal of Information Systems, 18:4, 372-383, DOI: 10.1057/ejis.2009.22
Meyer A., Barton E. L., Fritz T., Murphy C. G., Zimmermann T., (2017) The work-life of developers: activities, switches and perceived productivity https://www.zora.uzh.ch/id/eprint/136503/1/productiveWorkday_TSE17.pdf
Meyer N. A., Fritz T., Murphy C. G., Zimmermann T. (2014) Software Developers’ Perceptions of Productivity https://dl.acm.org/doi/10.1145/2635868.2635892
Mockus A., Fielding T. R., and Herbsleb D. J. (2002) Two case studies of open source software development: Apache and Mozilla. ACM Trans. Softw. Eng. Methodol. 11, 3 (July 2002), 309–346. DOI: https://doi.org/10.1145/567793.567795
Moser and O. Nierstrasz, "The effect of object-oriented frameworks on developer productivity," in Computer, vol. 29, no. 9, pp. 45-51, Sept. 1996, DOI: 10.1109/2.536783.
Nguyen L. H., Ignat C. (2018) An Analysis of Merge Conflicts and Resolutions in Git-based Open Source Projects. Computer Supported Cooperative Work, Springer Verlag, 27 (3-6), pp.741-765. ff10.1007/s10606-018-9323-3ff. ffhal-01917249f
Oliveira E., Fernandes E., Steinmacher I., Cristo M., Conte T., Garcia A., (2020) Code and commit metrics of developer productivity: a study on team leaders perceptions https://doi.org/10.1007/s10664-020-09820-z
Petersen K., (2010) Measuring and predicting software productivity: A systematic map and review https://romisatriawahono.net/lecture/rm/survey/software%20engineering/Software%20Product%20Lines/Petersen%20-%20Measuring%20and%20predicting%20software%20productivity%20-%202011.pdf
Scacchi W. (1995) Understanding Software Productivity https://www.researchgate.net/publication/2620175
Scholtes I., Mavrodiev P., Schweitzer F. (2015) From Aristotle to Ringelmann: a large-scale analysis of team productivity and coordination in Open Source Software projects https://www.sg.ethz.ch/publications/2016/scholtes2016from-aristotle-to/paper_bQeEC8G.pdf
Sheetz D. S., Henderson D., Wallace L. (2009) Understanding developer and manager perceptions of function points and source lines of code https://doi.org/10.1016/j.jss.2009.04.038
Storey A. M., Zimmermann T., Bird C., Czerwonka J., Murphy B., and Kalliamvakou E., "Towards a Theory of Software Developer Job Satisfaction and Perceived Productivity," in IEEE Transactions on Software Engineering, vol. 47, no. 10, pp. 2125-2142, 1 Oct. 2021, DOI: 10.1109/TSE.2019.2944354
Trendowicz A., Münch J. (2009) Factors Influencing Software Development Productivity - State-of-the-Art and Industrial Experiences. Advances in Computers. 77. 185-241. https://doi.org/10.1016/S0065-2458(09)01206-6

This article is a short summary of the master thesis of Stefan Stojkovski. If you’re interested in the whole thesis, feel free to contact Stefan.
Contents